Quick and easy analytics for C-level decision-making
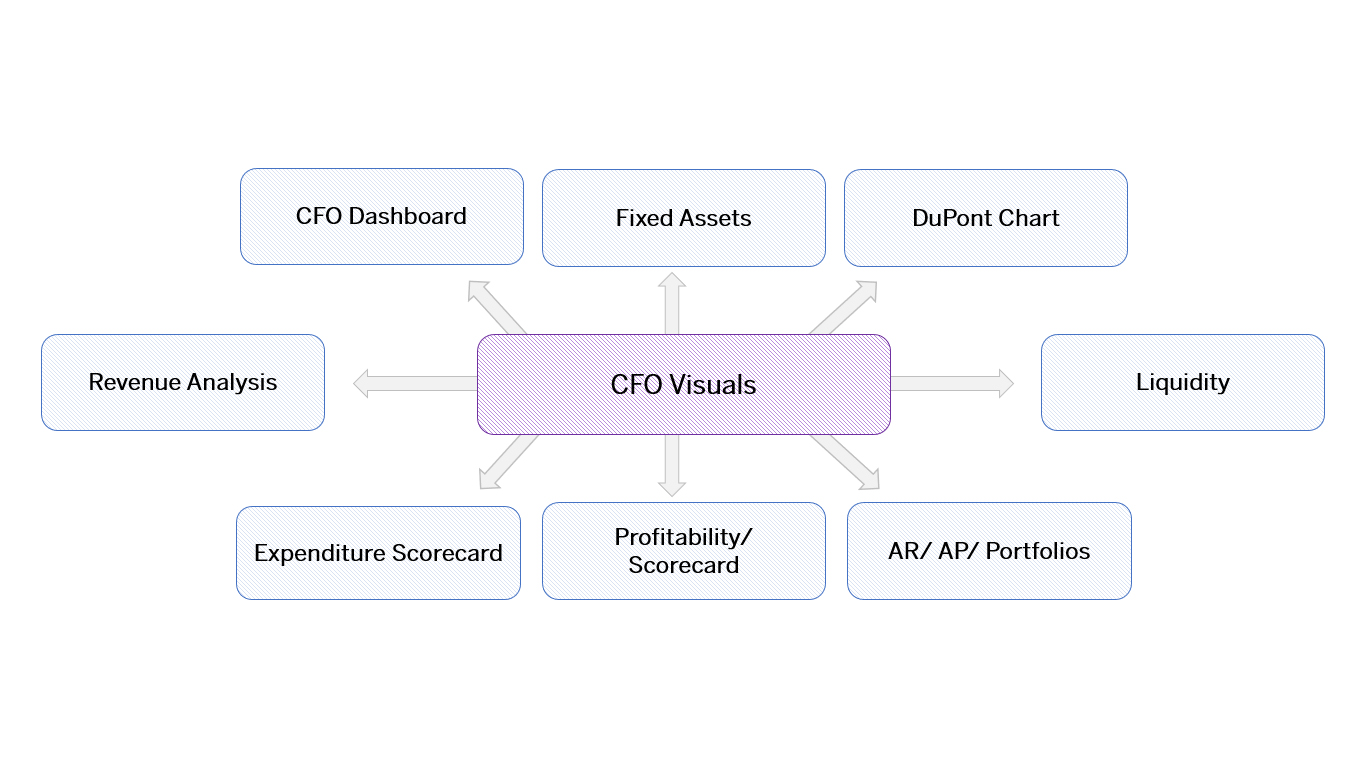
CFO Visuals is a comprehensive Performance Management pre-built solution specifically developed for the CFO level officers and Senior Management of Finance Organization of all verticals, covering the following major areas and KPIs.
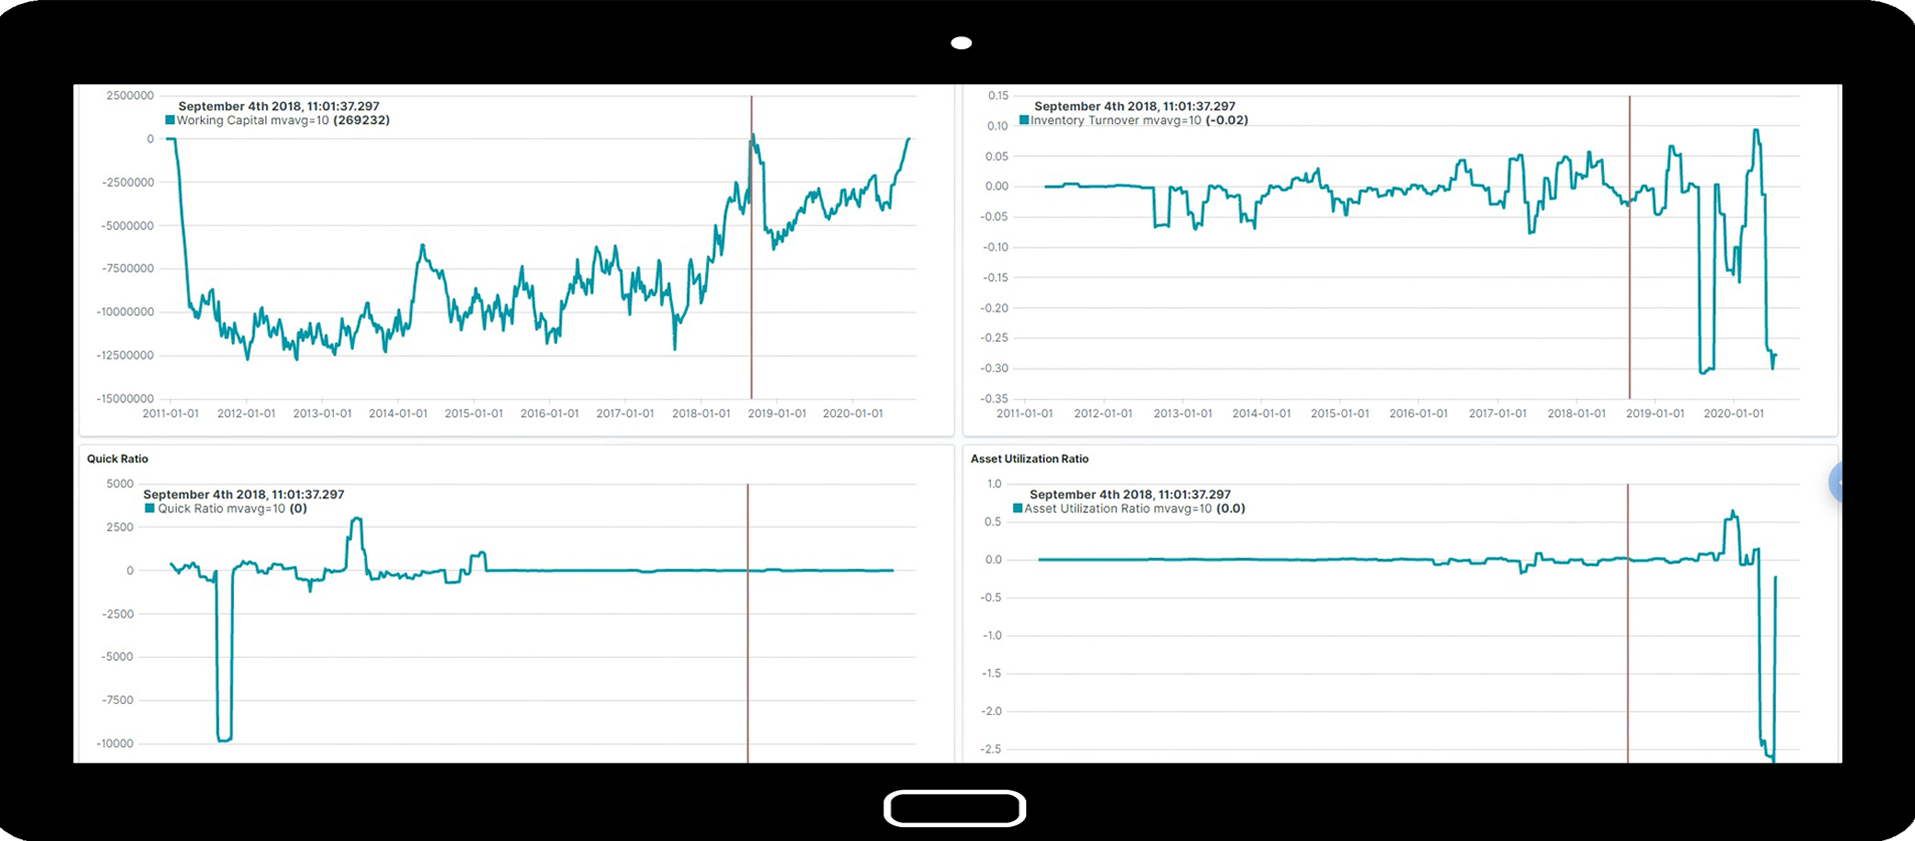
Financial Efficiency Dashboard
Working Capital, Quick Ratios, Inventory Turnover, Asset Utilization Ratio
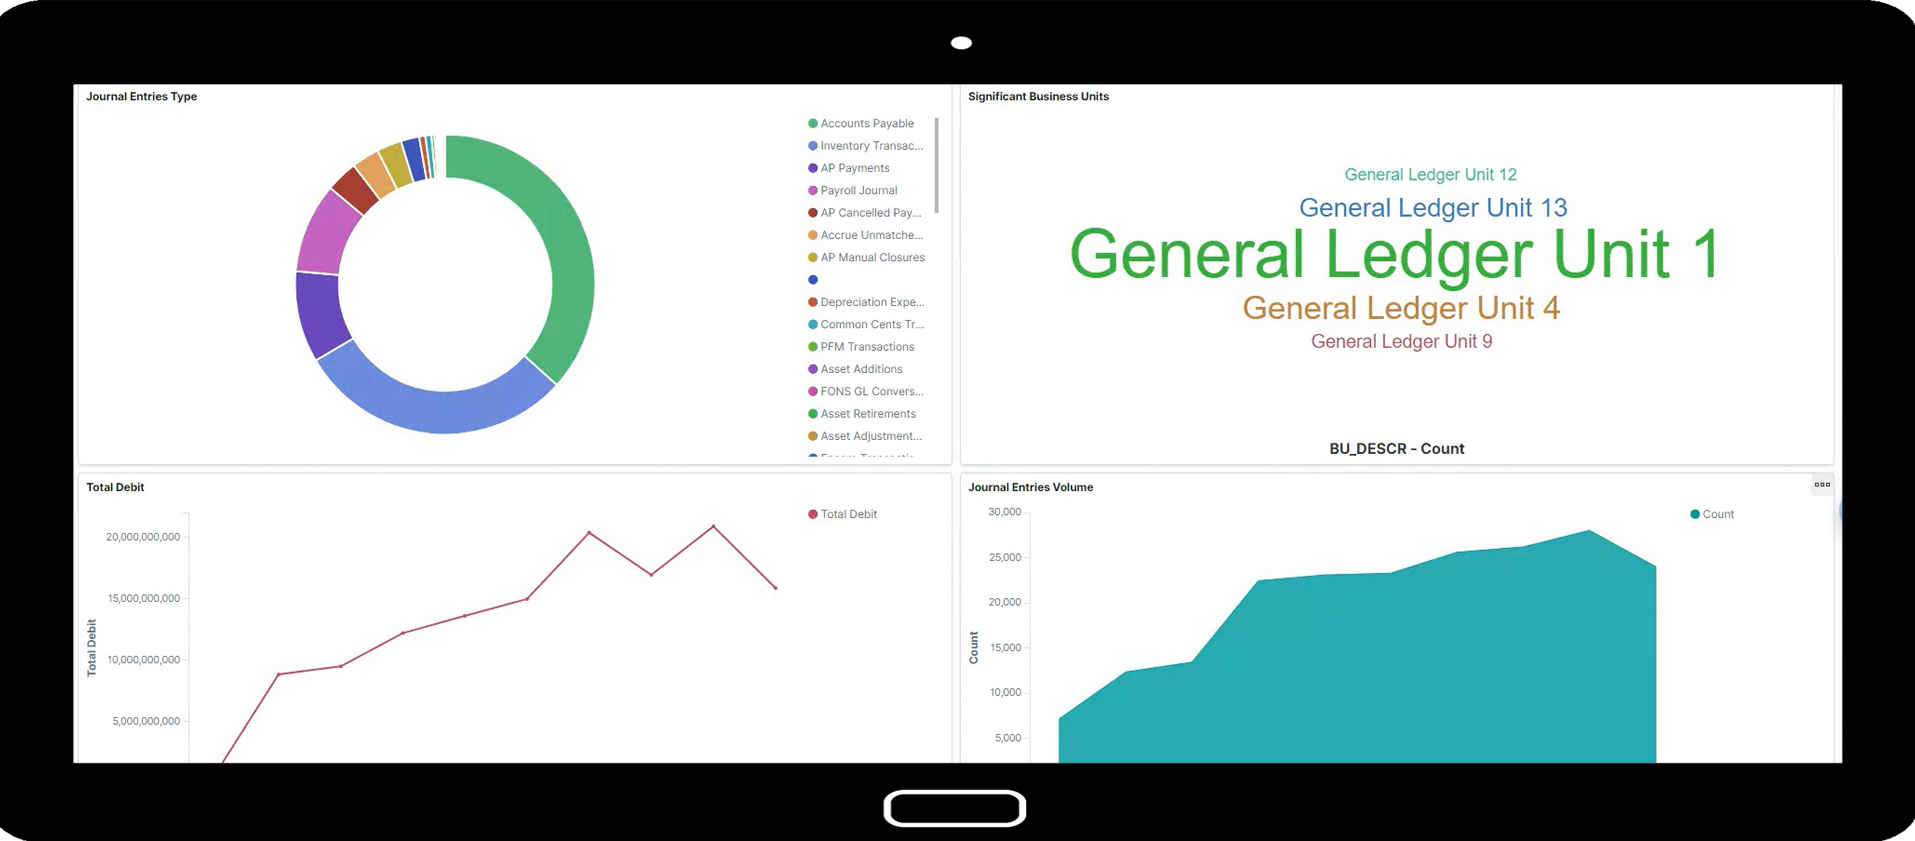
General Ledger Dashboard
Journal Entries Type, Significant Business Units, Total Debit, Journal Entries Volume
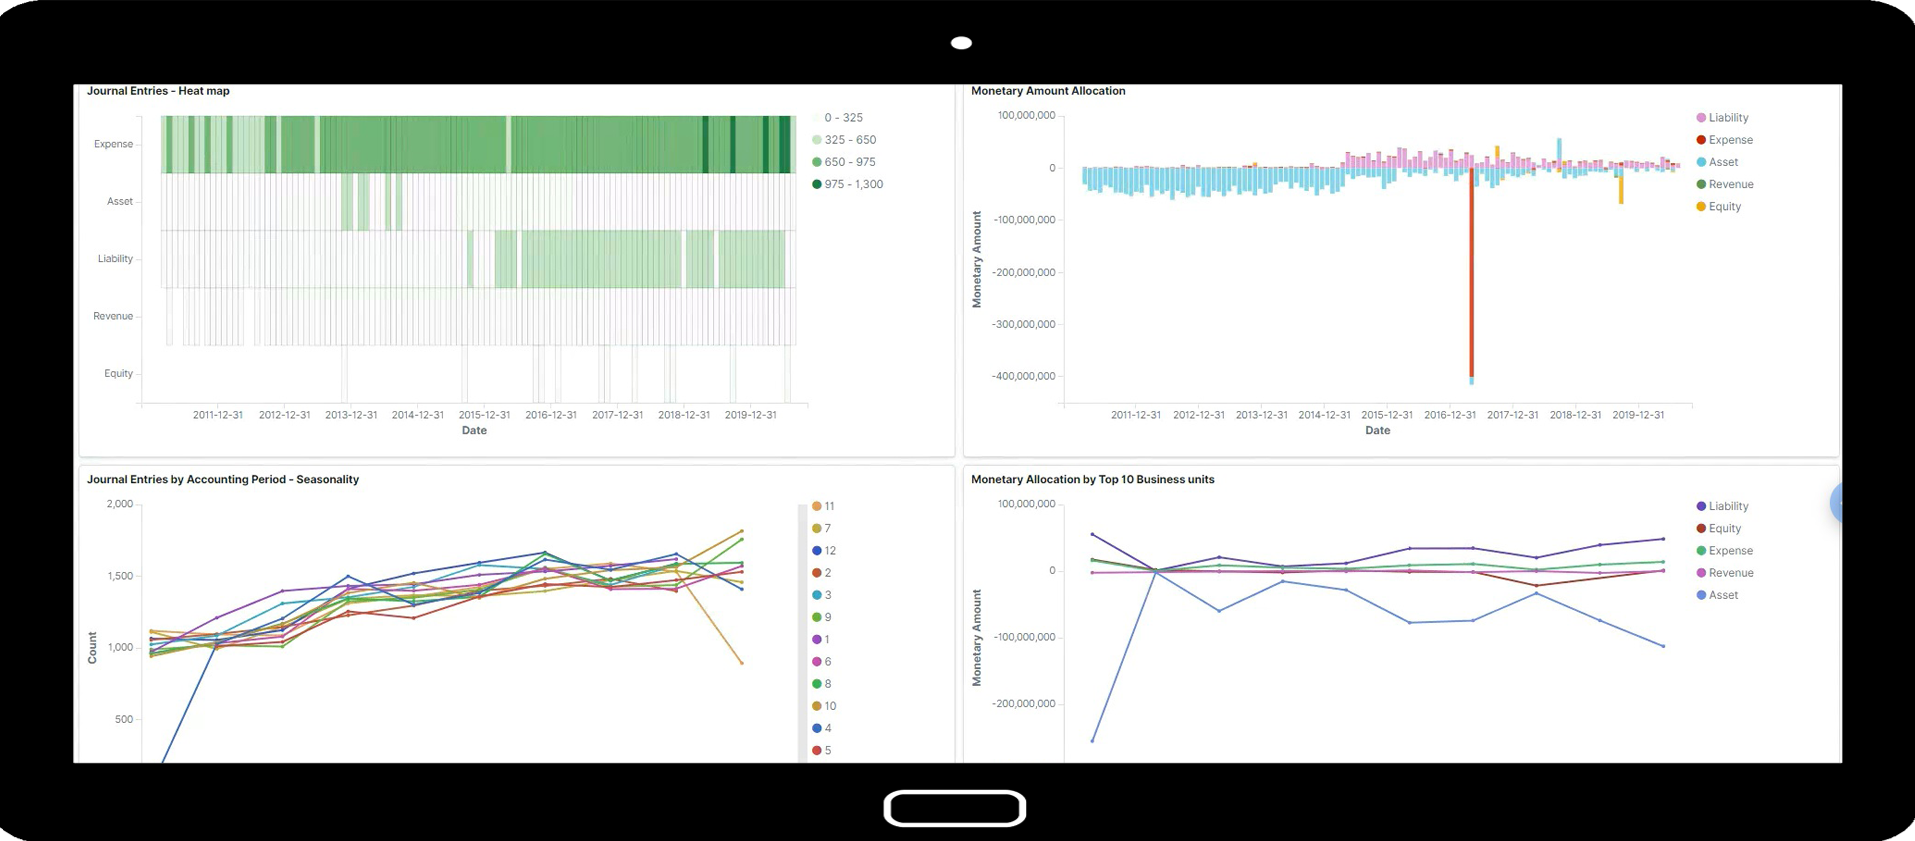
Journal Entries Dashboard
Journal Entries, Journal Entries by Accounting Period, Monetary Amount Allocation, Monetary Allocation by Top 10 Business Units
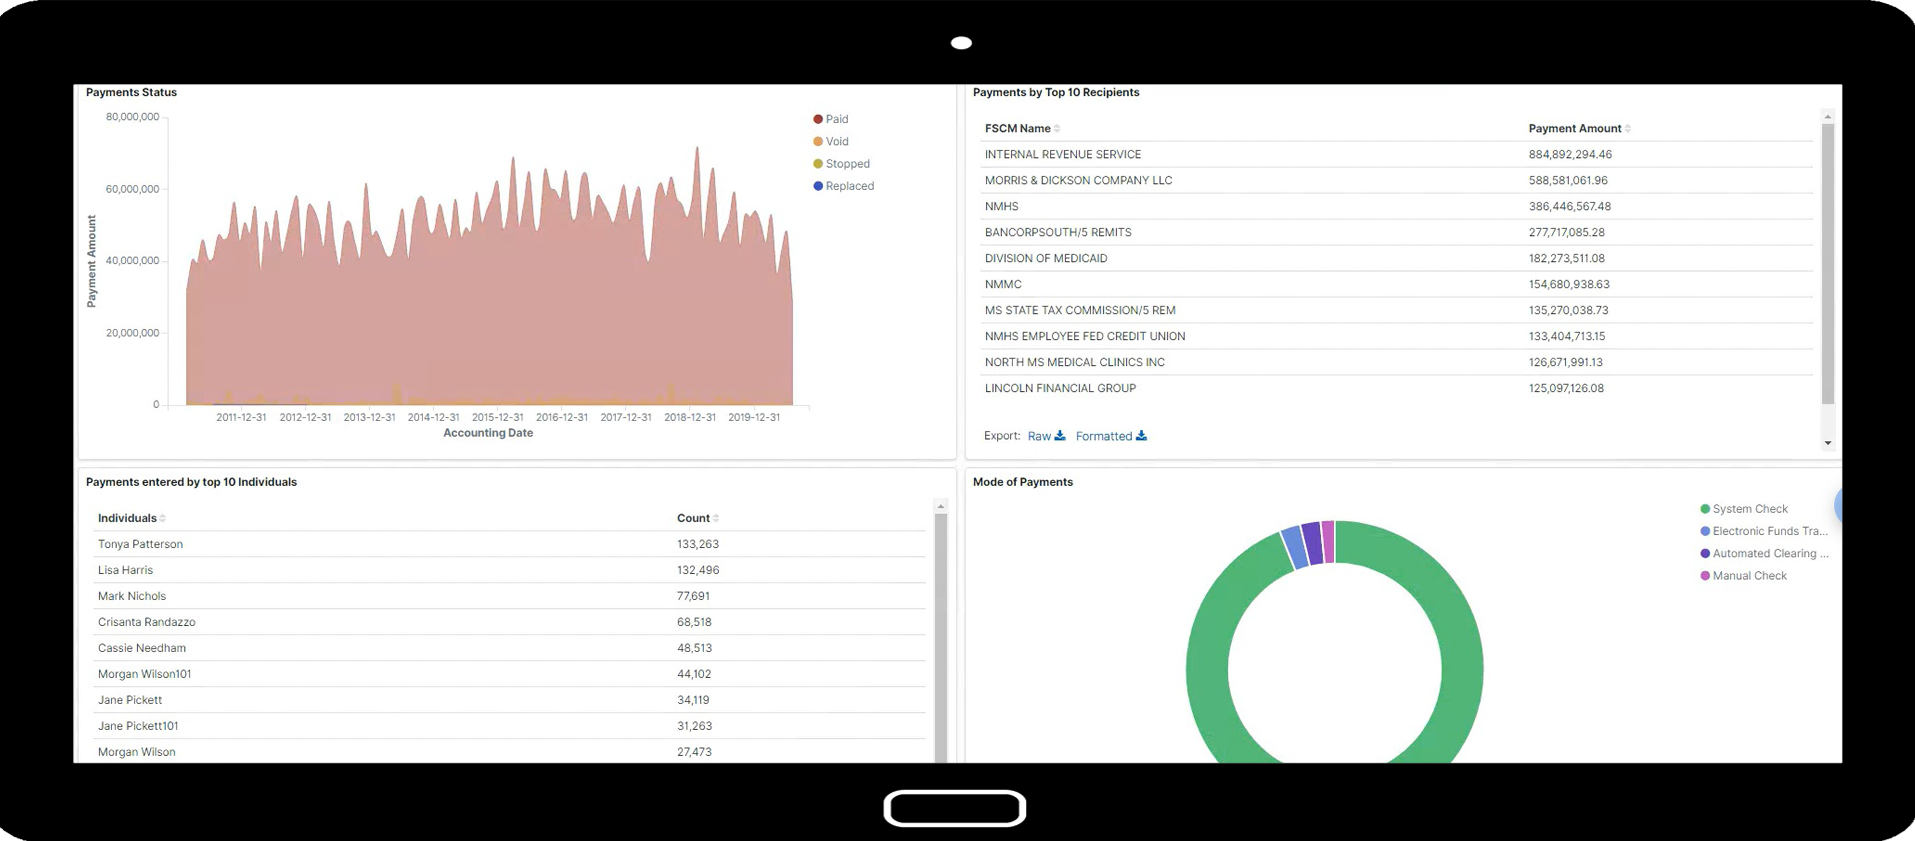
Payments Dashboard
Payments Status, Payments by Top 10 Individuals, Payments by Top 10 Recipients, Mode of Payments
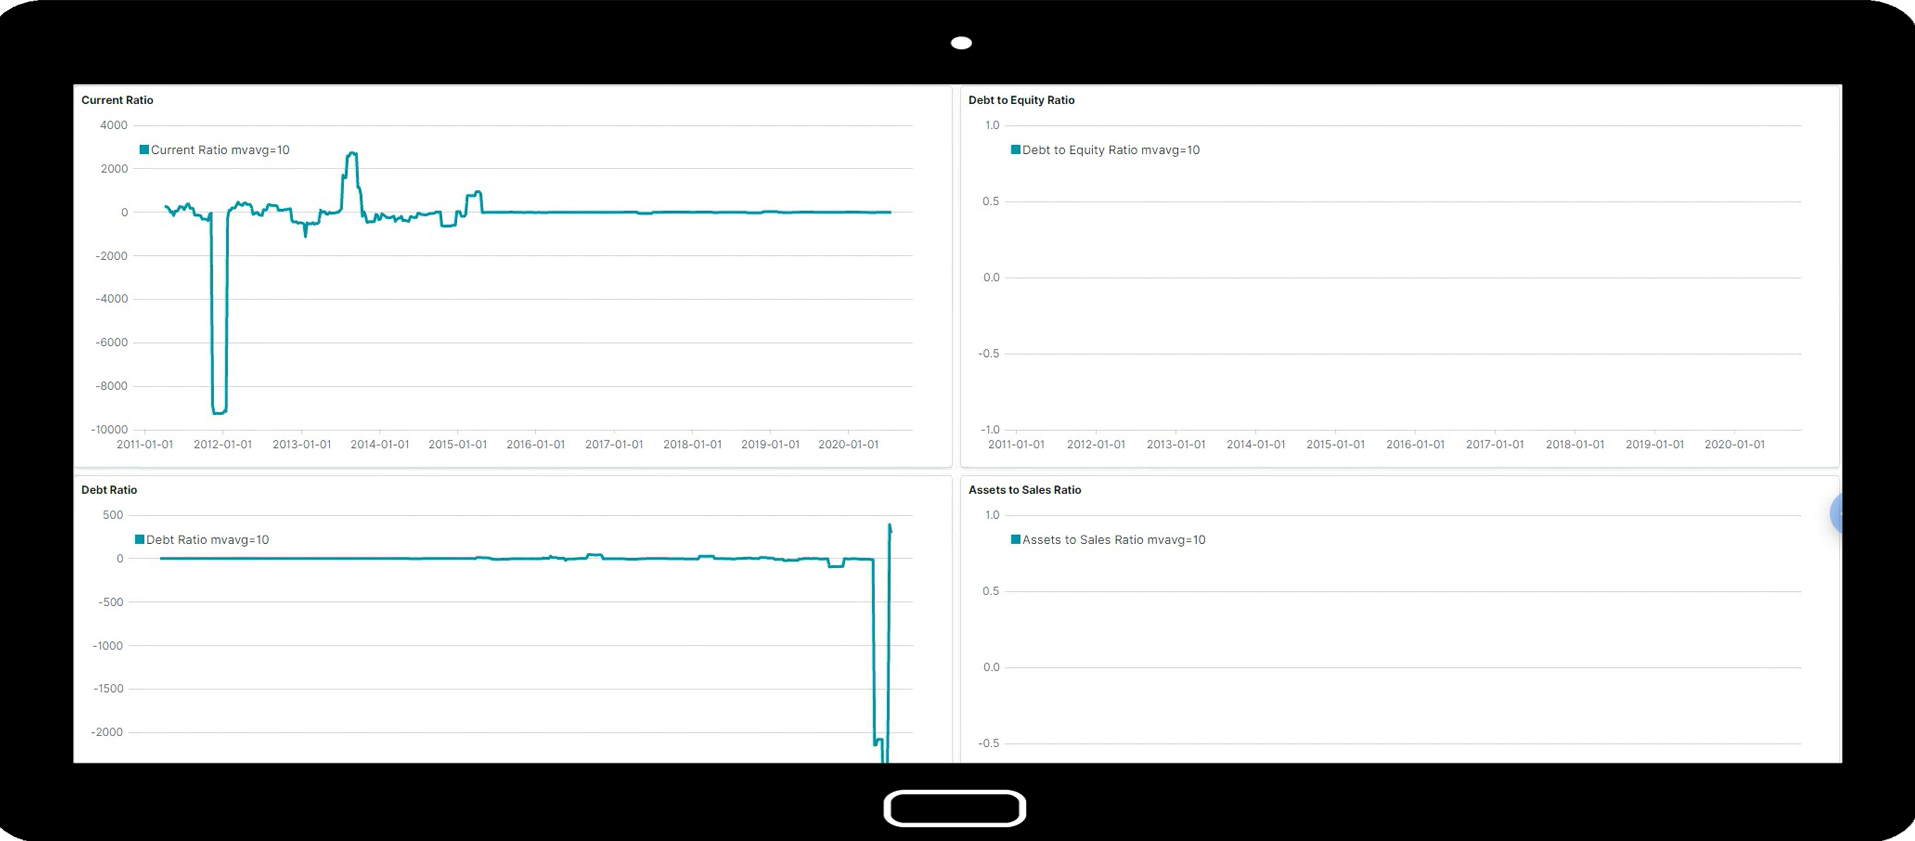
Liquidity Dashboard
Current Ratio, Debt Ratio, Debt to Equity Ratio, Assets to Sales Ratio
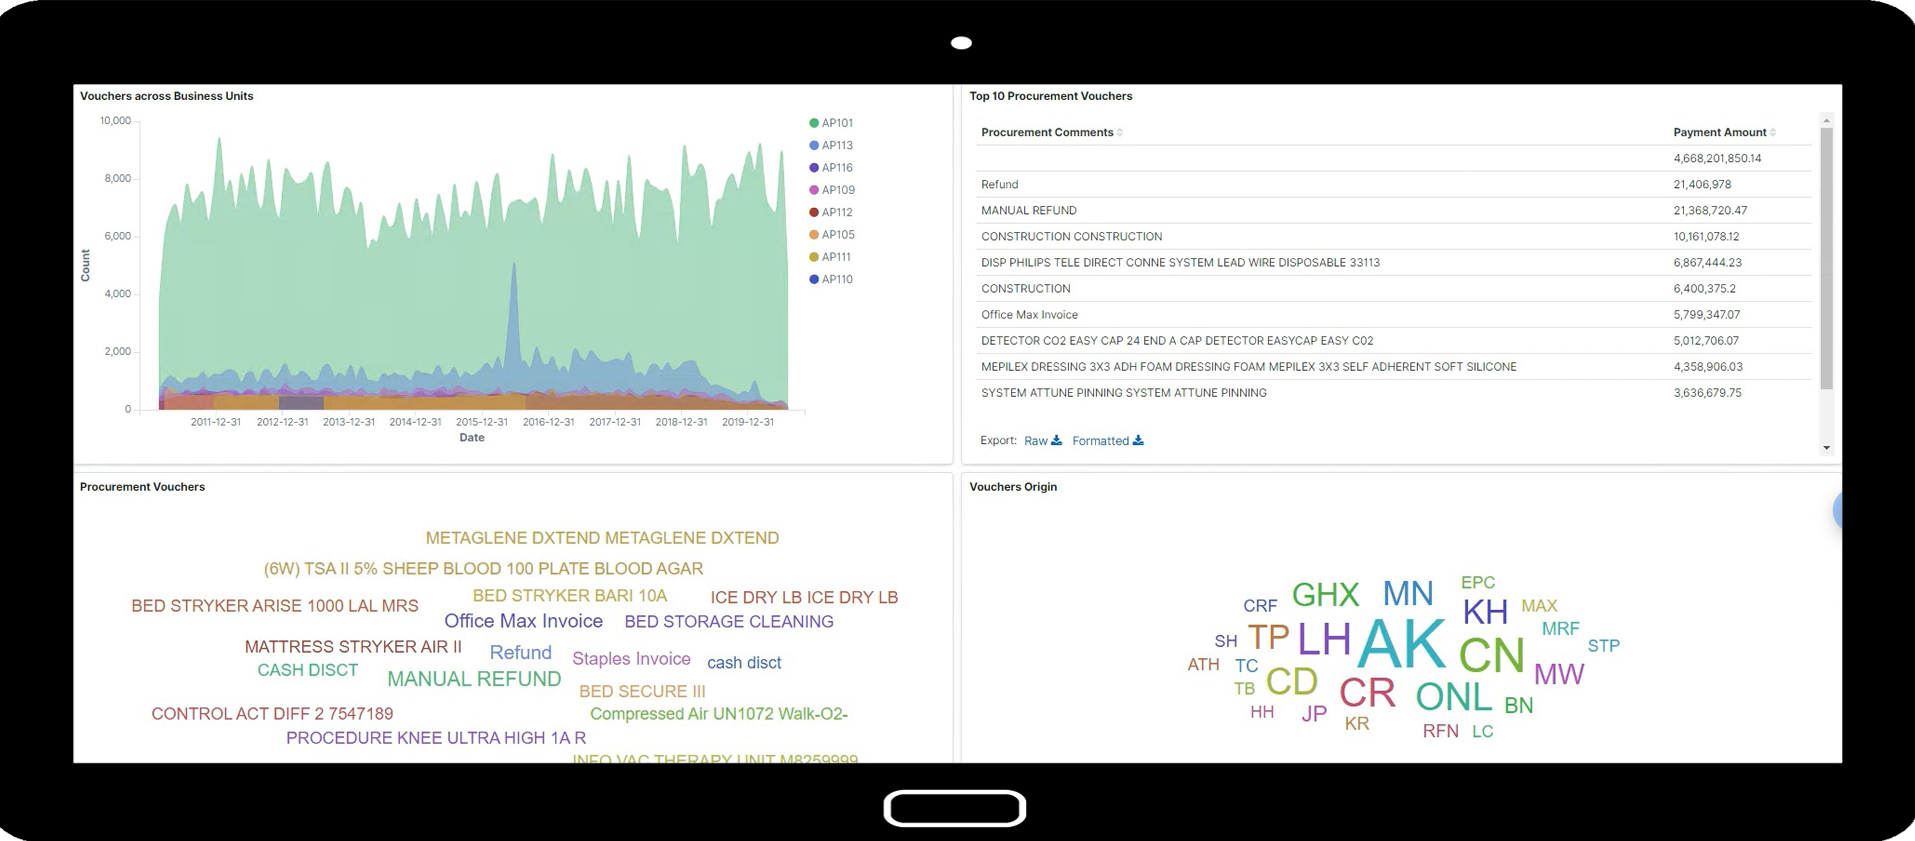
Procurement Vouchers Dashboard
Vouchers Across Business Units, Procurement Vouchers, Top 10 Procurement Vendors, Vouchers Origin
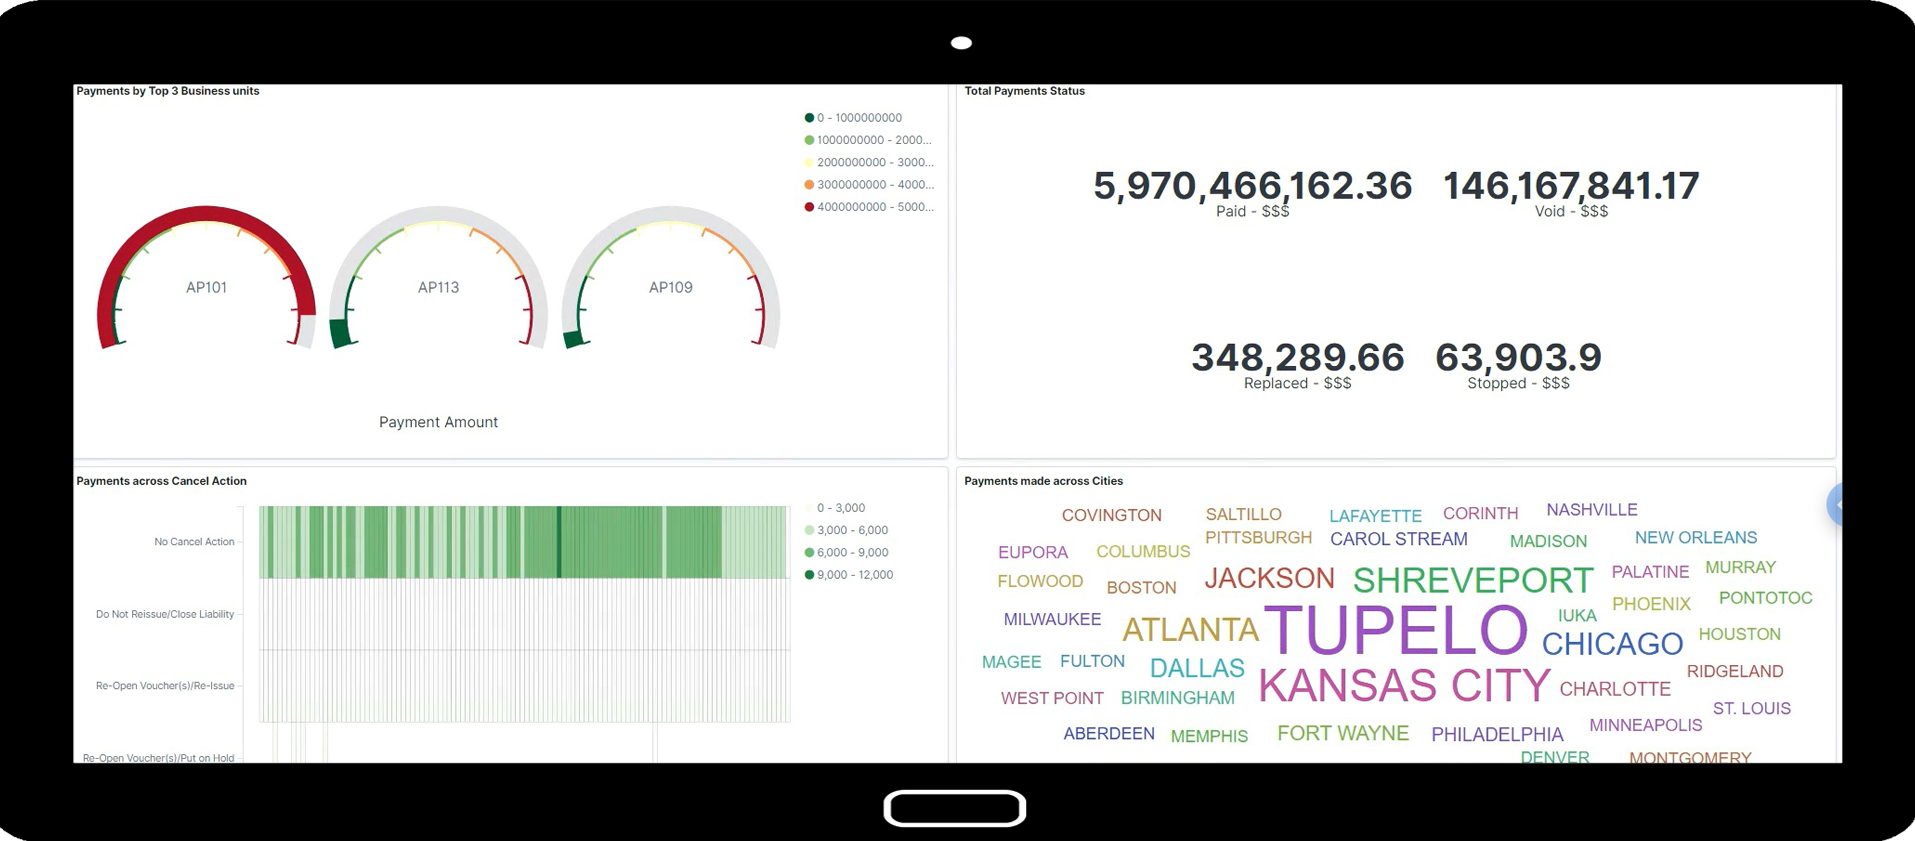
Payments Dashboard
Payments by Top 3 Business Units, Payments Across Cancel Action, Total Payments Status, Payments Made Across Cities
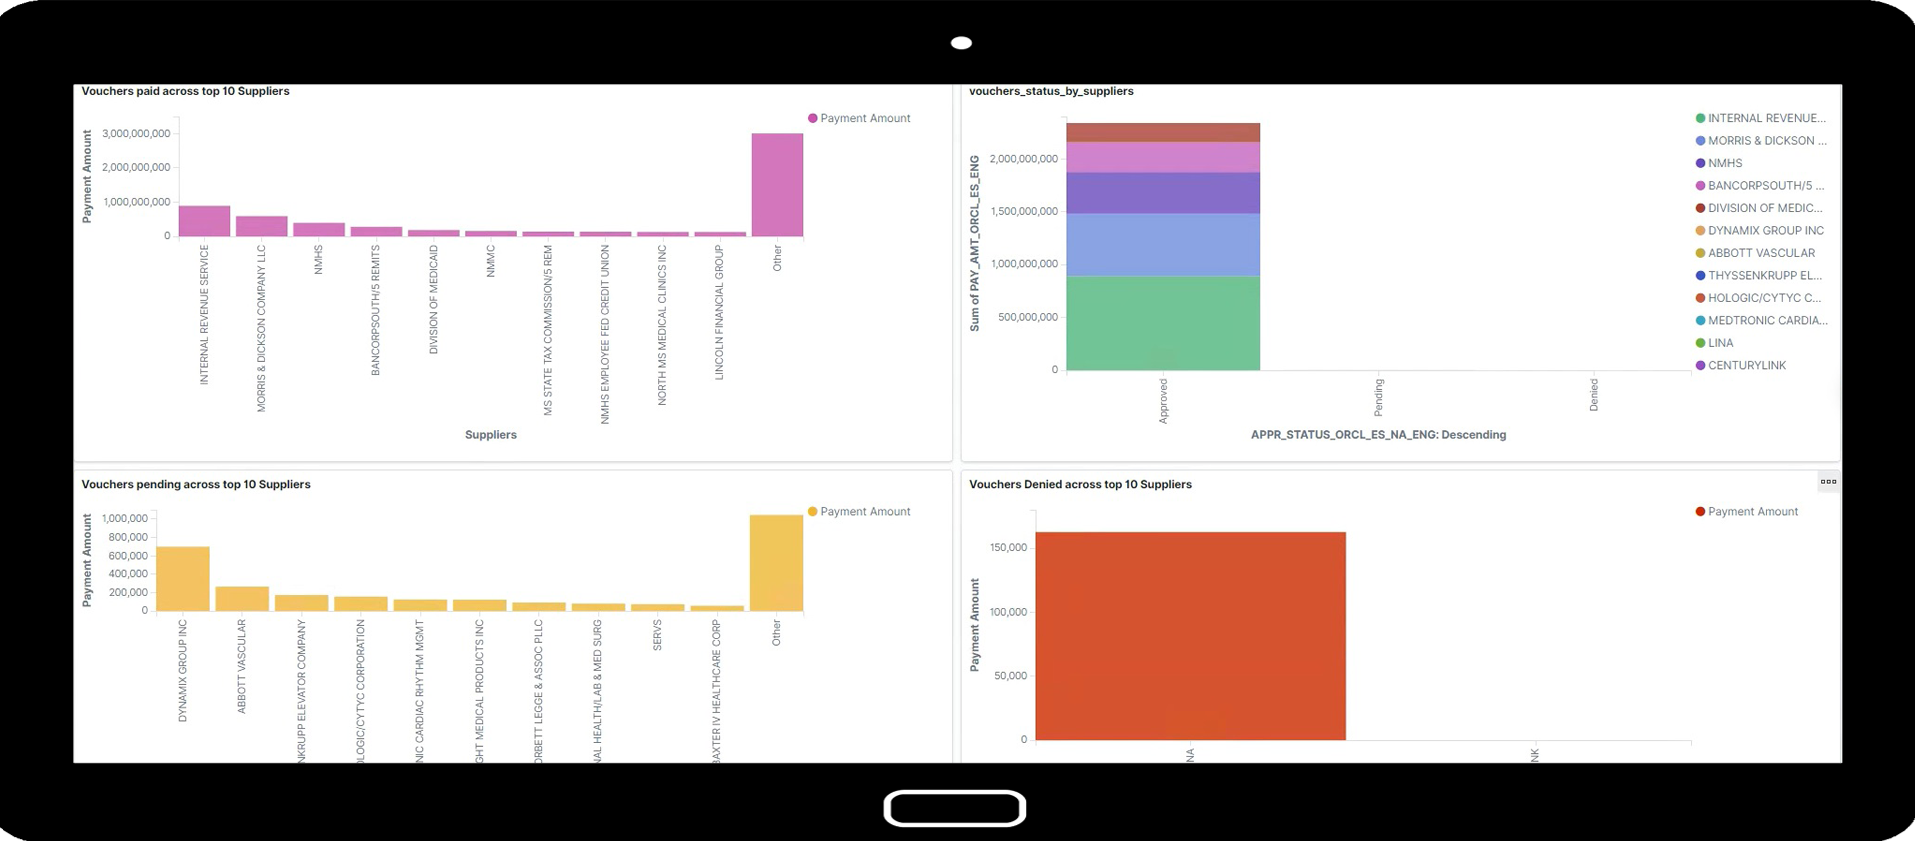
Vouchers Approval Dashboard
Vouchers Paid Across Top 10 Suppliers, Voucher Status by Supplier, Vouchers Pending Across Top 10 Suppliers, Vouchers Denied Across Top 10 Suppliers
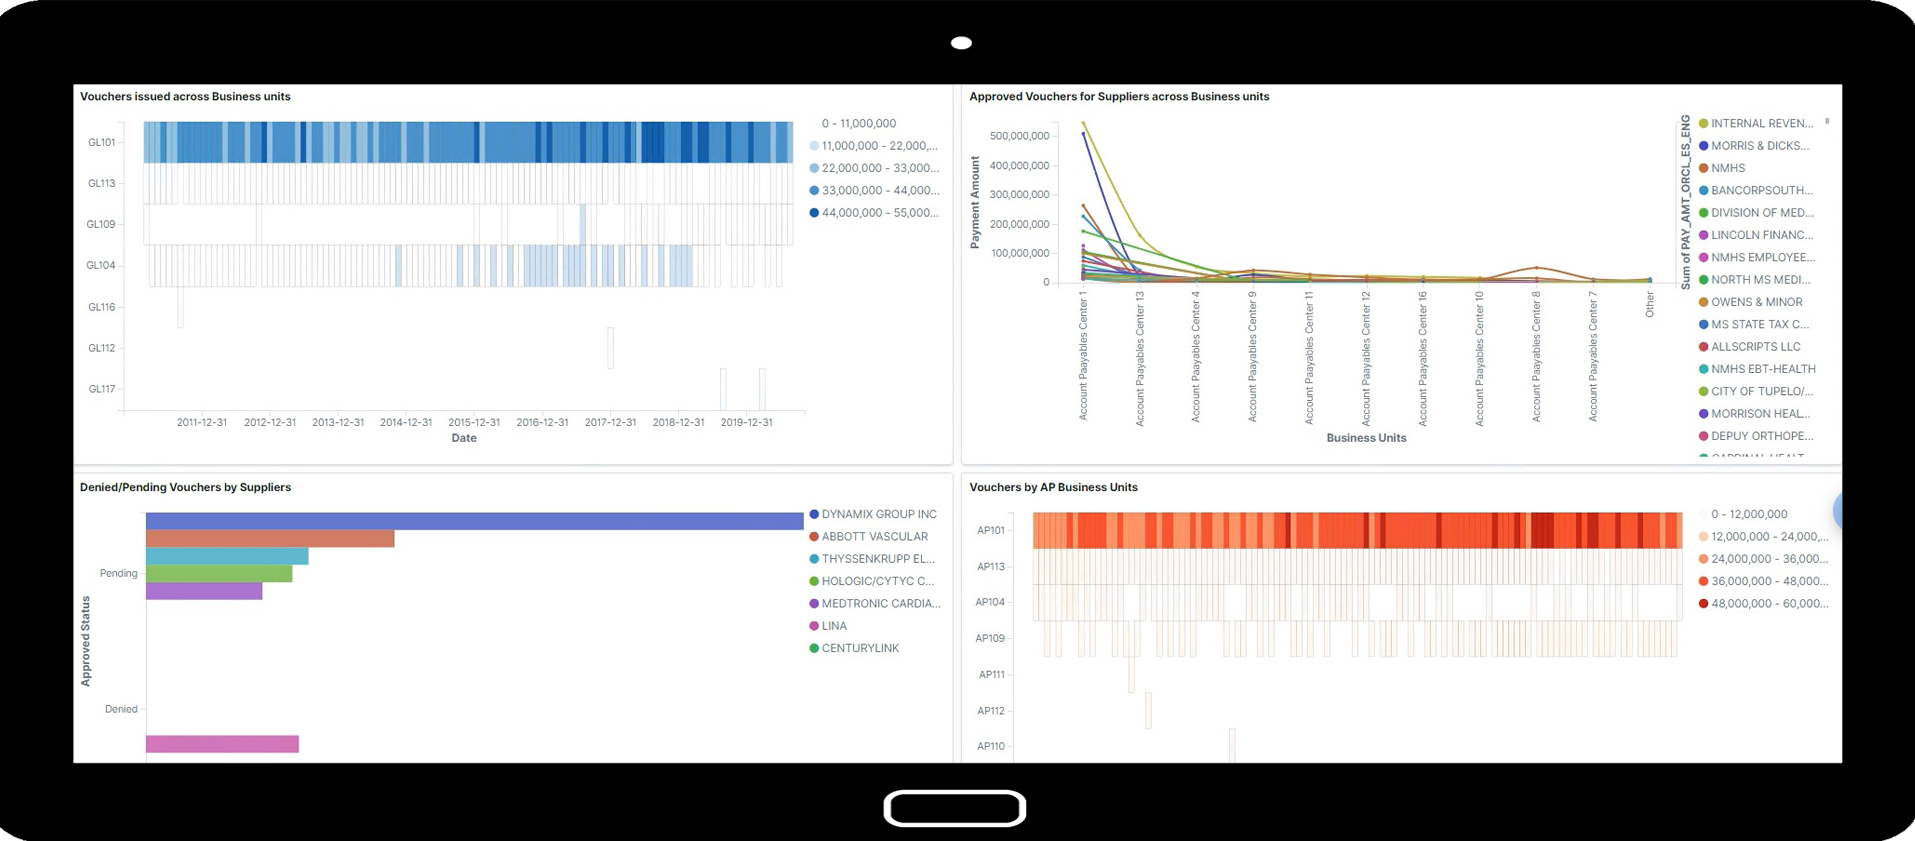
Vouchers by Business Unit Dashboard
Vouchers Issued Across Business Units, Approved Vouchers for Suppliers Across Business Units, Denied/ Pending Vouchers by Suppliers, Vouchers by AP Business Units
Financials
- CFO overview
- Finance scorecard
- DuPont
Revenue
- Sales
- Services
- Other income
Expenditure
- Expenditure by cost type
- Expenditure by cost center
Profitability
- EBITDA
- PAT
Assets
- Fixed assets analysis
- Maintenance costs
Accounts Receivable
- Receivables analysis
- Customer analysis
- Customer leader board
Accounts Payable
- Payables analysis
- Customer analysis
- Customer leader board
Treasury & Cash Management
- Liquidity
- Portfolio concentration
- Capital management
- Hedging
Procurement & Contract
- Procurement analysis
- Procure to pay
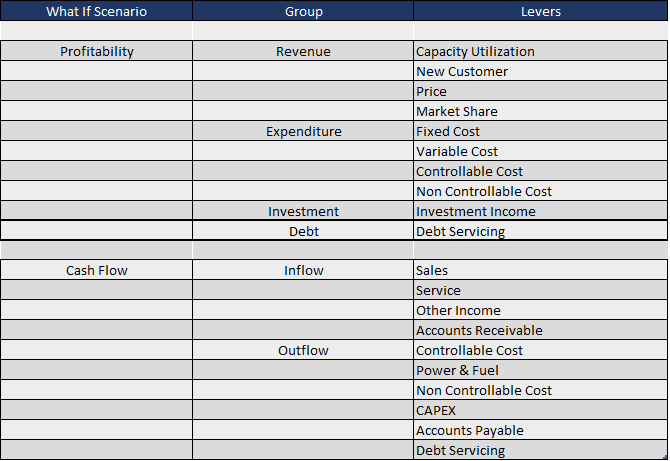
What-if Scenarios – Predictive Analytics
